Post-Graduate Outcomes
From career counseling and job placement to support for judicial clerkships and public interest work, UCLA Law is helping grads achieve their goals.
UCLA Law's Office of Career Services and Office of Public Interest Programs work hard to ensure that graduates gain a solid foothold in the job market. From On-Campus Interviews to career fairs to special panels with alumni on topics such as working on the East Coast or careers in national security, the school provides many opportunities for graduates to launch their careers successfully. The school offers generous stipends and a loan repayment program for those pursuing careers in public interest law, and its judicial clerkship programs open doors to positions in state and federal courts.
Employment Statistics
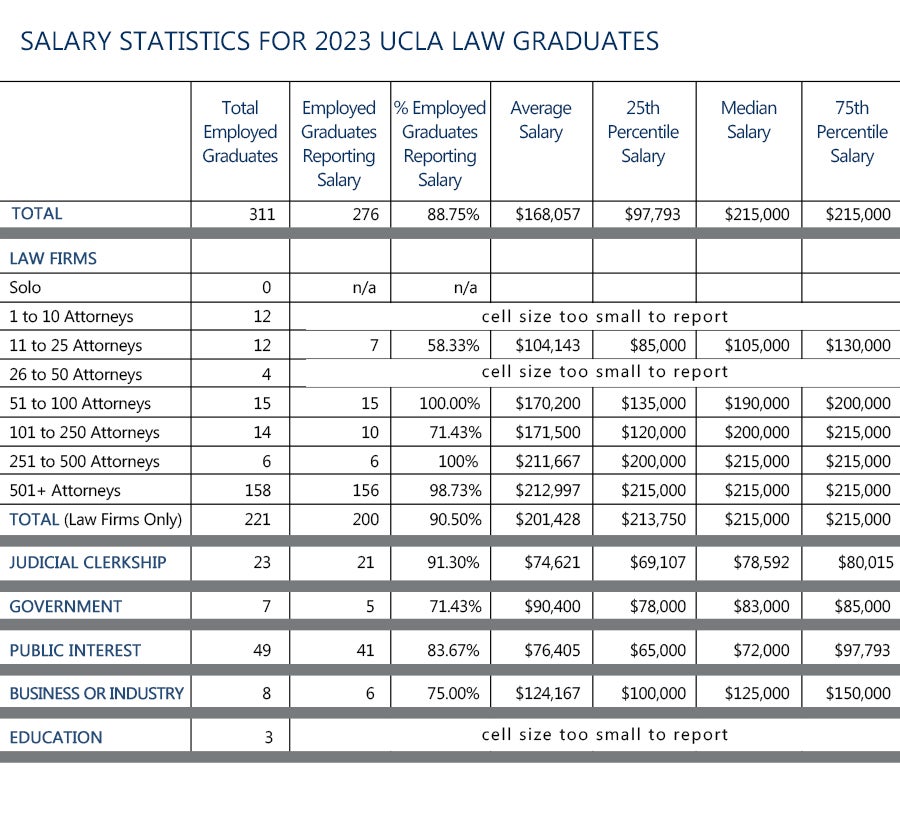
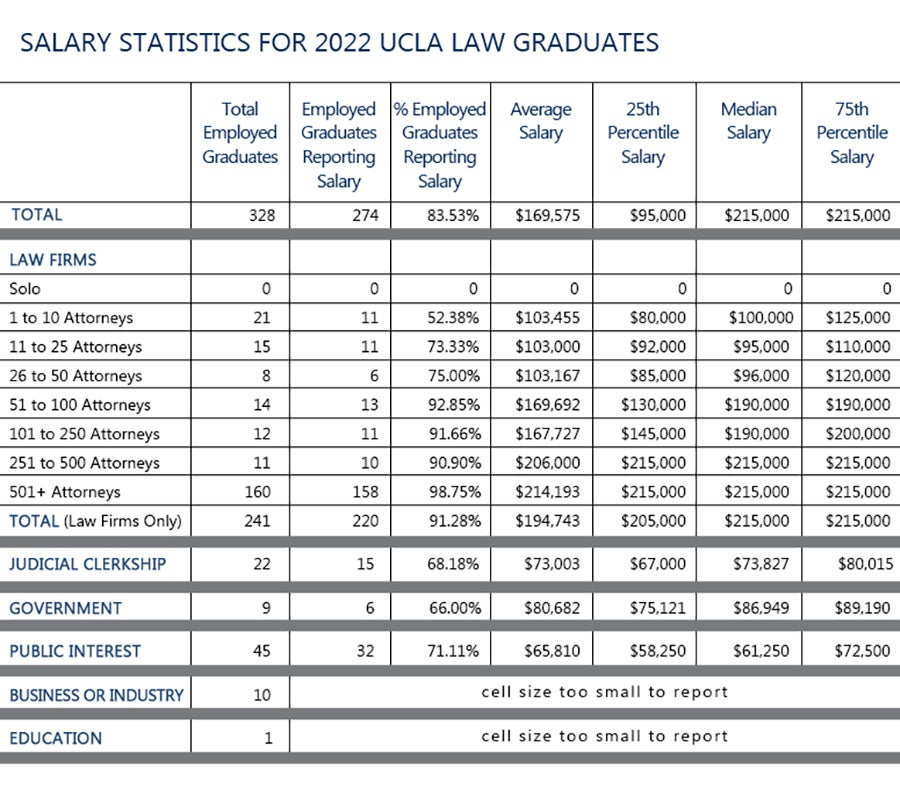
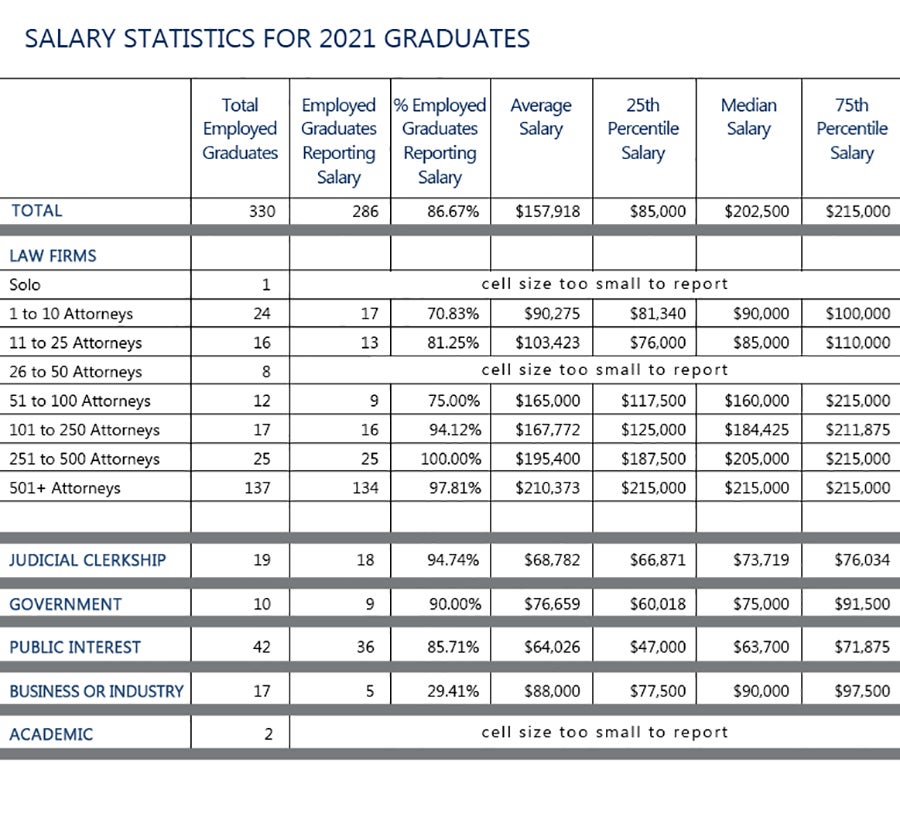
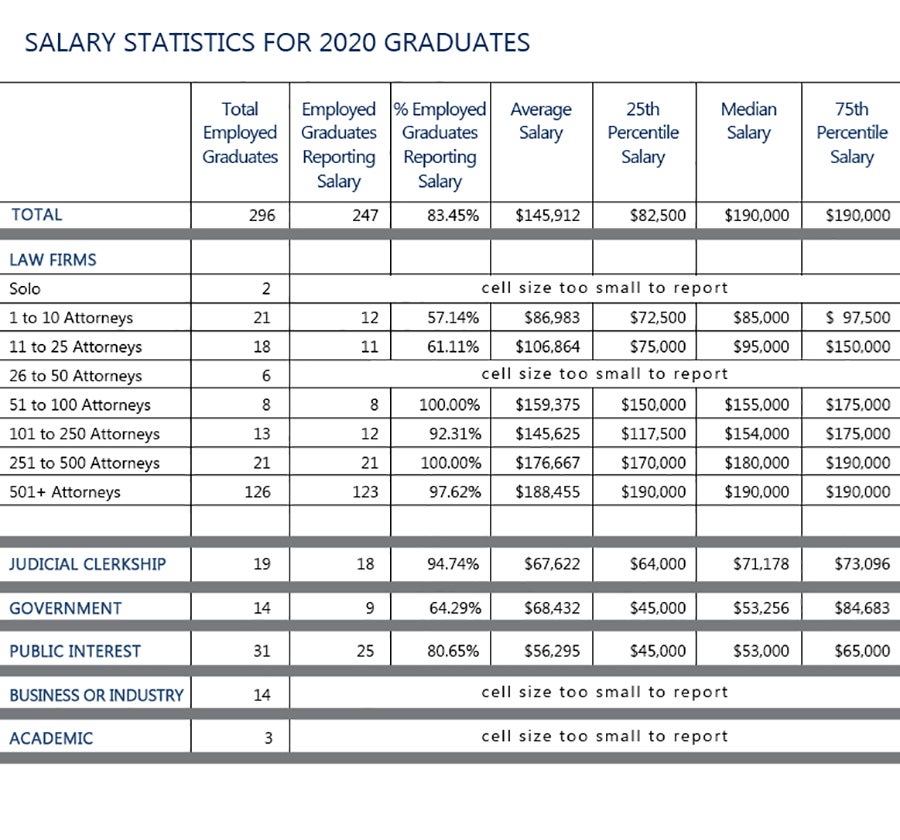
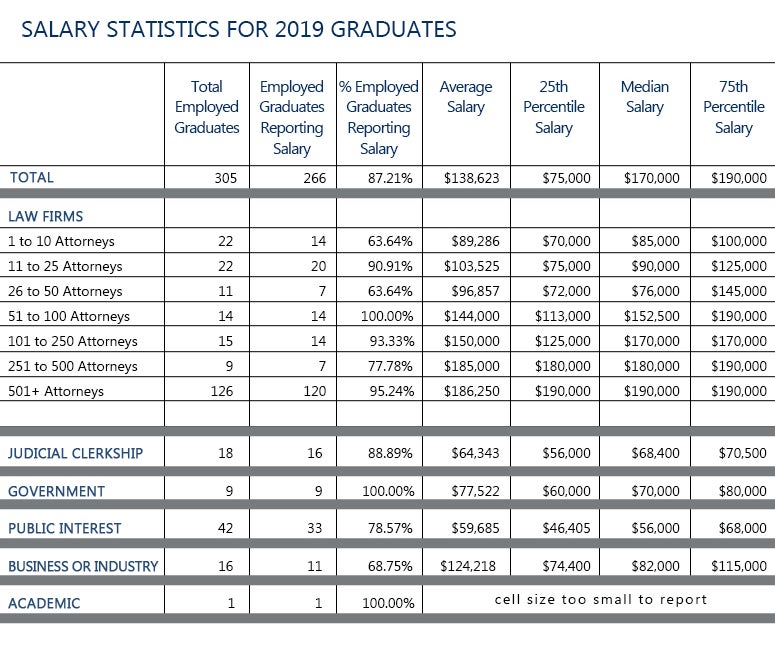
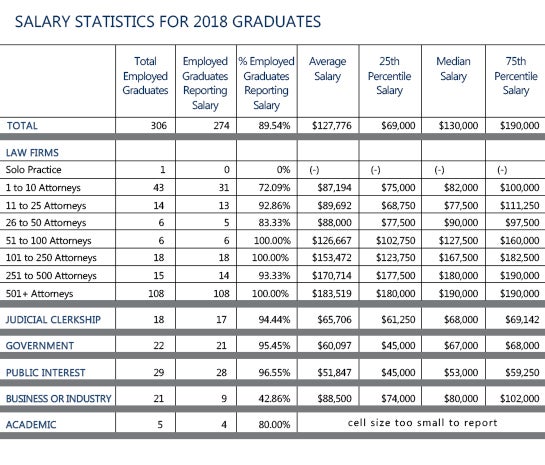
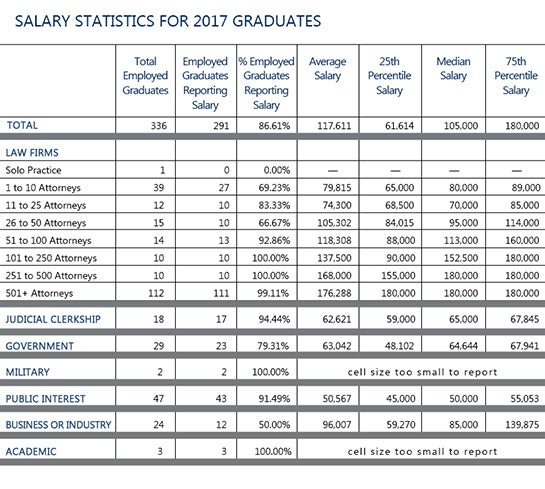
Employment and salary information is taken from a variety of sources including student self-reporting, alumni surveys, employer information, published salary data and electronic resources. All salary statistics are based on full-time, long-term positions only. Salary data are not published when there are less than five salaries reported. Categories in the salary statistics chart are based on National Association for Law Placement definitions, which include placing public defenders in the public interest category rather than in the government category.
-
2024 Graduates
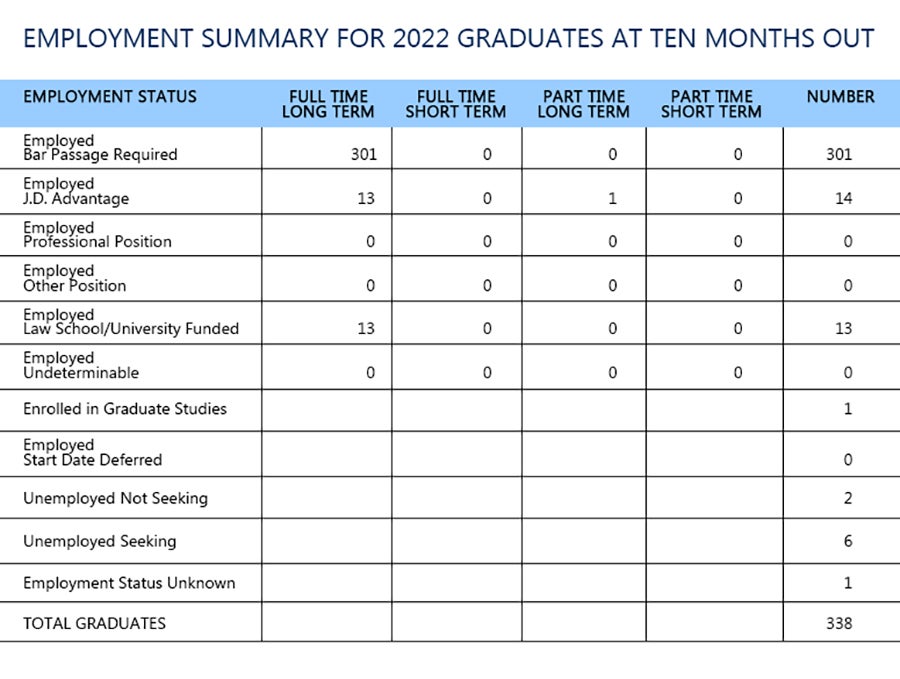
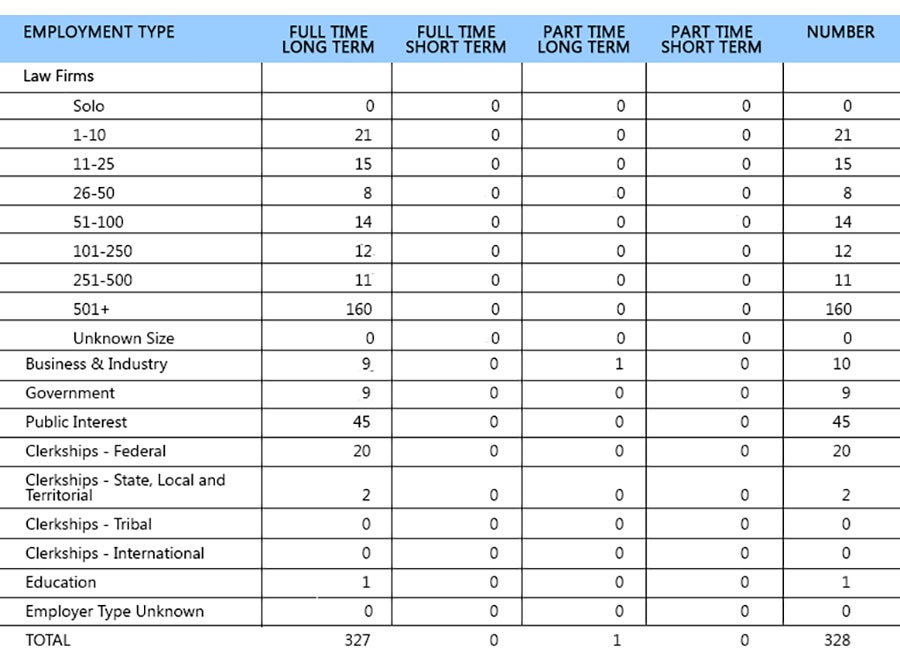
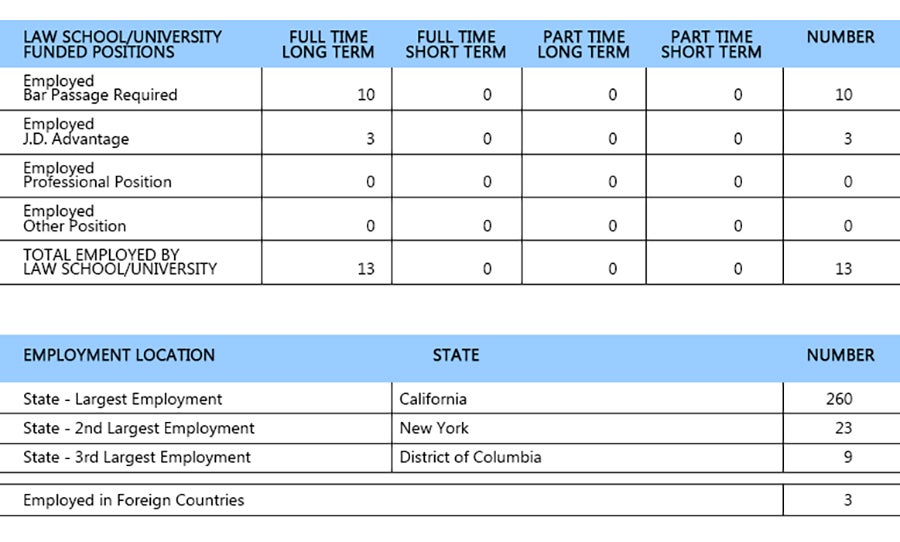
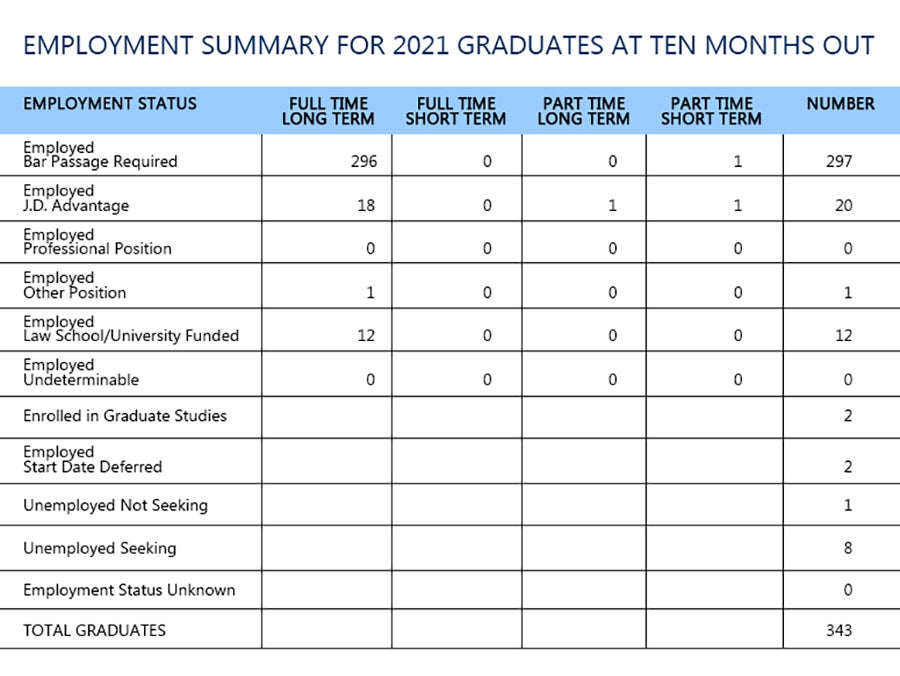
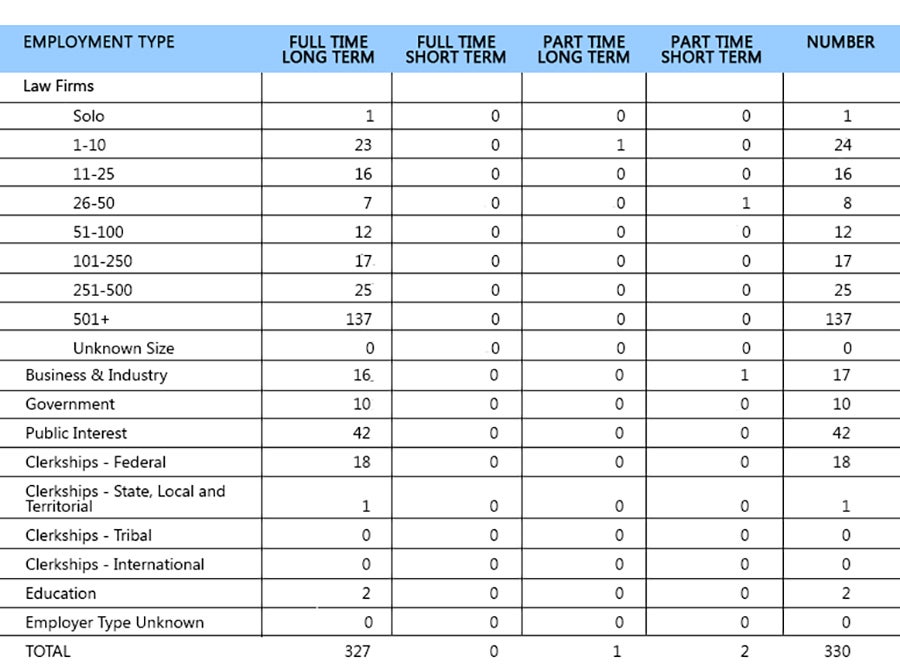
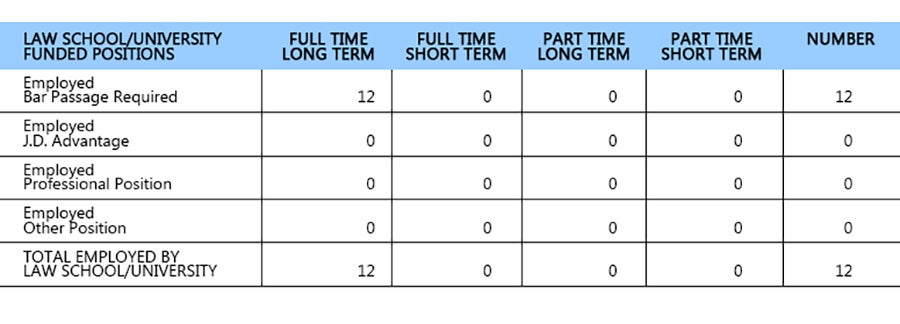
Employment Data for the Class of 2024 provided in ABA standard format.
Salary Statistics for Class of 2024 UCLA Law Graduates
Total Employed Graduates Employed Graduates Reporting Salary % Employed Graduates Reporting Salary Average Salary (Mean) 25th Percentile Salary Median Salary 75th Percentile Salary TOTAL (all employer types) 362 314 86.74% 179,000 110,000 225,000 225,000 Law Firms Solo 0 0 0 0 0 0 0 1 to 10 Attorneys 18 9 50.00% 110,000 100,000 110,000 120,000 11 to 25 Attorneys 15 13 86.67% 112,428 85,000 120,000 125,000 26-50 Attorneys 10 6 60.00% 159,167 140,000 152,500 165,000 51-100 Attorneys 8 7 87.50% 198,571 190,000 215,000 225,000 101 to 250 Attorneys 15 12 80.00% 192,500 190,000 200,000 200,000 251 to 500 Attorneys 12 10 83.33% 216,000 200,000 225,000 225,000 501+ Attorneys 188 185 98.40% 222,460 225,000 225,000 225,000 Total (Law Firms only) 266 242 90.98% 208,354 215,000 225,000 225,000 Judicial Clerkship 23 19 82.61% 79,151 75,524 80,000 85,000 Government 13 7 53.85% 79,057 60,000 81,242 92,844 Public Interest 53 42 79.25% 77,696 64,880 76,557 90,000 Business or Industry 5 cell size too small to report cell size too small to report cell size too small to report cell size too small to report cell size too small to report cell size too small to report Education 2 cell size too small to report cell size too small to report cell size too small to report cell size too small to report cell size too small to report cell size too small to report - 2023 Graduates
- 2022 Graduates
- 2021 Graduates
- 2020 Graduates
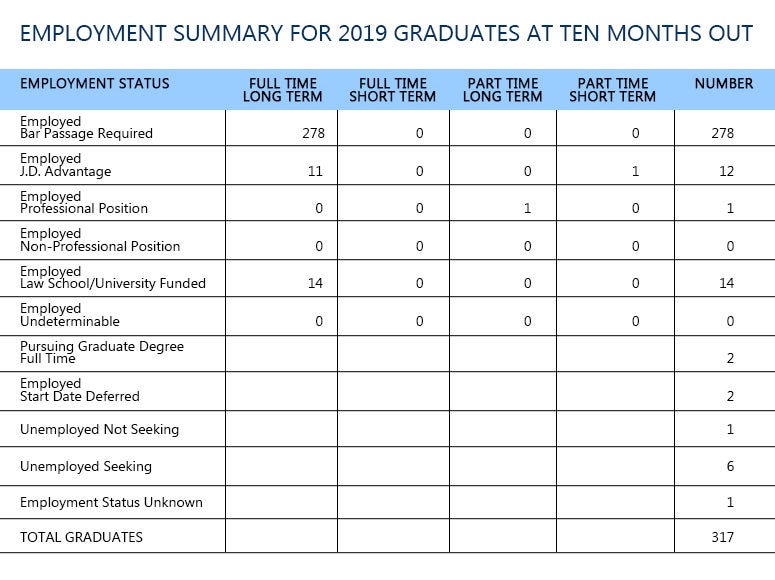
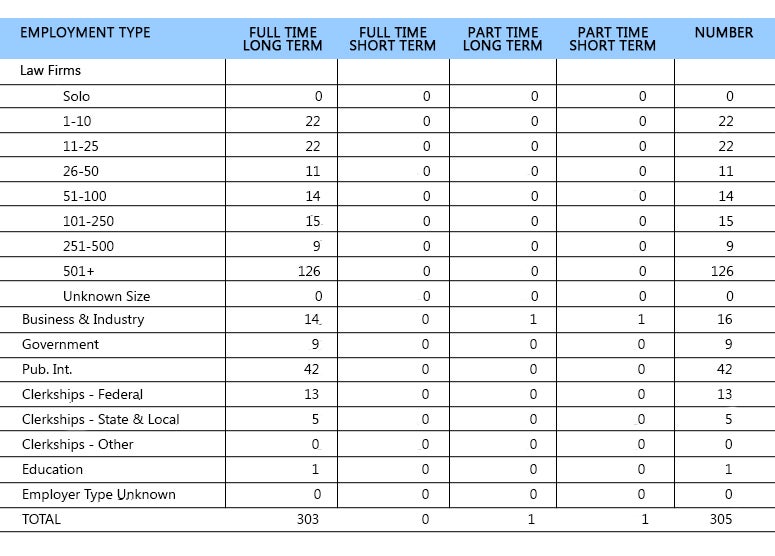
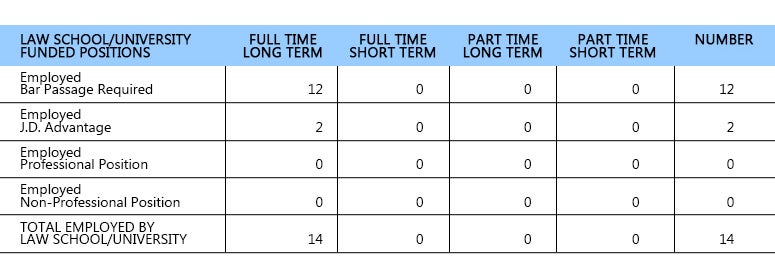
- 2019 Graduates
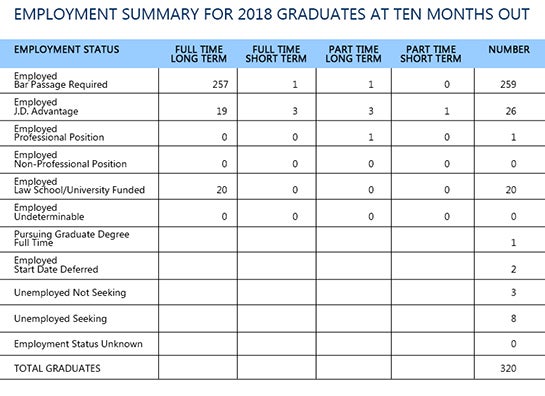
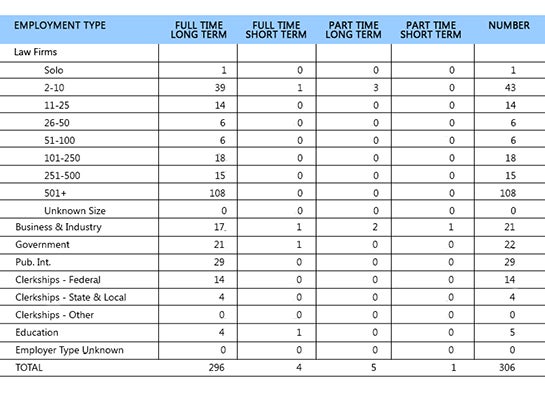
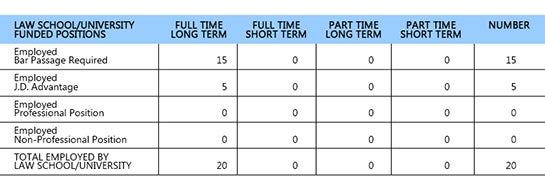
- 2018 Graduates
- 2017 Graduates
